



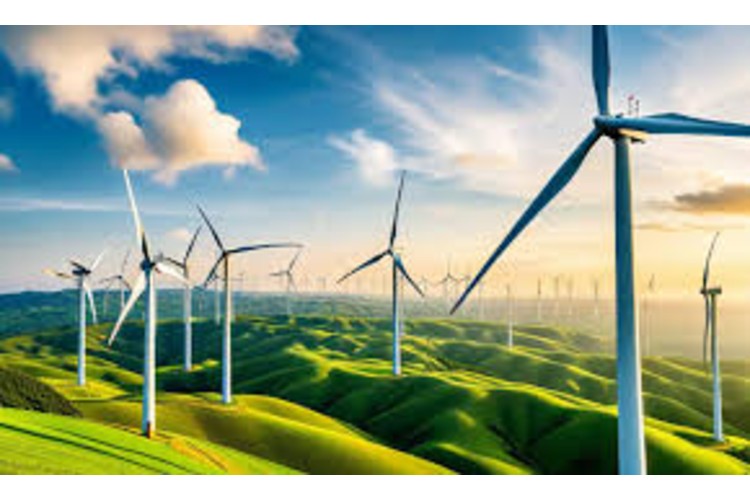
Something has quietly shifted in the power sector over the past five years, and most boardrooms haven’t fully caught up to it yet. Renewable energy isn’t the subsidized outlier anymore. In almost every market, it’s simply the cheapest way to add new generation capacity — full stop. New research from Market Intelo puts the global market at $1,050.0 billion in 2025, climbing to $1,969.8 billion by 2034, a compound annual growth rate of 8.6%. However, to be brutally honest, the bottom line is the least exciting aspect of the whole story. The real issues lie in understanding which technologies are making their way out of the pack, where the investment money is really flowing, and how the various barriers like power grid capacity and critical minerals and energy storage will shape the real winners of this story.
From Policy Niche to Core Infrastructure
Currently, solar and wind account for almost 65% of total renewable energy capacities globally, whereas the proportion of renewable electricity to total electricity production has grown from around 29% in 2020 to approximately 43%. The estimated future proportion of 70% in 2050 is quite realistic. Getting there isn’t cheap: net-zero pathways will require more than $40 trillion in cumulative capital through 2034, spread across generation, transmission, and storage. There’s also a policy tailwind building — more governments are expected to phase out fossil-fuel subsidies in favor of competitive tenders and green financing, which should smooth out some of the country-by-country unpredictability that’s historically made renewable investment harder to underwrite.
Why This Growth Isn’t a Passing Cycle
The cost curve tells the real story here. Solar module prices have dropped roughly 99% since 2010 — from over $370 per watt down to about $0.27 per watt today. Onshore wind capital costs are down more than 55% in that same window, and battery storage costs have fallen close to 90%, which is finally what’s made four-to-six-hour storage systems commercially viable rather than aspirational. None of this is a subsidy artifact. It’s manufacturing scale and engineering progress, which is a much sturdier foundation for a growth thesis.
Policy has also hardened into something closer to enforcement than encouragement. More than 130 countries now hold net-zero commitments, and over 90 have renewable portfolio standards mandating minimum clean-electricity shares. Carbon pricing — the EU’s Emissions Trading System being the most consequential example — has pushed carbon costs high enough to genuinely disadvantage coal and gas dispatch economically. In the US, investment tax credits of up to 30% under the Inflation Reduction Act remain a key anchor for developer returns, even as the political debate around that law periodically rattles financing confidence.
Then there’s energy security, which turned out to be a bigger accelerant than almost anyone predicted. The chaos seen in the energy market between 2022 and 2024 due to European dependency on Russian gas, which provided about 40 percent of EU’s gas requirements, shifted renewables from being an environmental issue to that of national security. Europe began to increase its renewable capacity at an annual rate of 8 to 10 GW, and the same pattern is evident in other countries like India, Japan, and South Korea.
And demand itself is climbing in a way that favors renewables almost by default. Sales of EVs have touched 14 million vehicles in 2024, 18% of passenger vehicle sales worldwide, while forecasts indicate an increase of 50% in sales till 2034 alone, accounting for more than 500 terawatt-hours of additional electricity consumption per year. Include electrification of buildings in this scenario and the world’s electricity demand will rise by 120% from 2025 to 2050, with renewable energy meeting the bulk of this extra demand.
Where the Capital Is Actually Going
The sun continues to be the main player, accounting for about 38.5% of the total 2025 market (around $404 billion) with a CAGR of 9.8%, which is faster than the overall market growth. Heterojunction and n-type silicon cells have increased commercial efficiencies to 22–25%, while perovskite-silicon tandem solar cells and building-integrated photovoltaics are extending the possibilities for solar power generation beyond traditional rooftop and ground-mounted systems.
Wind energy is the second largest segment, accounting for around 27.5% ($289 billion) with a 7.8% CAGR. The interesting story here is in offshore capacity. While fixed-bottom installations currently operate at capacity factors in excess of 50%, as opposed to 35–40% in onshore installations, offshore floating wind capacity – just getting into the commercial development phase – might make several hundreds of gigawatts available in deeper waters. Offshore capacity in Europe will grow from around 57 GW currently to over 200 GW by 2030.
Hydropower stands at around 19% market share but is the least growing major sector with CAGR at just 3.2% due more to geographic and regulatory factors than economic ones. It’s strength isn’t in its growth, rather in the flexibility of hydro and pumped storage plants that can ramp up or down in minutes making them an ideal complement to intermittent renewables.
Bioenergy accounts for about 10% market share and CAGR of 6.5% providing dispatchable, weather-independent energy sources and playing an increasing role in aviation and maritime biofuels. Geothermal, at roughly 3% market share, is forecast to be the fastest growing traditional energy source at 11.2% CAGR, thanks in large part to Enhanced Geothermal Systems, potentially expanding installed capacities from current 14 GW to 100 GW plus by mid century. The smallest sector bucket of ocean energy, concentrated solar power, and green hydrogen is also forecast to grow the fastest at approximately 14.5% CAGR.
Asia Pacific Keeps Widening Its Lead
Asia Pacific holds the largest regional share at around 42%, anchored by China’s installed renewable base of more than 1,200 GW — nearly half the global total on its own. India’s competitive solar auctions have pushed tariffs down to some of the lowest in the world, sustaining tens of gigawatts in annual additions on the way to its 280 GW target. Second place goes to Europe thanks to the EU’s Green Deal objective of attaining a share of roughly 80% of renewables in electricity production by 2030. For North America, it is largely dependent on the clean-energy provisions of the Inflation Reduction Act, with Texas being at the forefront when it comes to wind power and California leading when it comes to solar. Latin America and the Middle East/Africa have lower figures but they could be considered the highest growth frontiers.
Regulation Worth Watching
Carbon pricing is spreading well beyond Europe into Asian and North American markets, reshaping dispatch economics against coal and gas as it goes. Renewable portfolio standards — now active in 90-plus countries — are converting climate ambition into binding procurement requirements for utilities. Critical raw materials policy is becoming its own regulatory priority, with the US and EU both building out domestic battery manufacturing and mineral-processing capacity to reduce their exposure to lithium and cobalt supply-chain concentration. Regulators are also paying closer attention to grid codes and interconnection standards, which reflects a growing recognition that transmission — not generation — is the real constraint in several major markets right now.
Corporate Buyers Are a Real Second Engine
Utility buildout gets most of the attention, but corporate procurement has quietly become a demand engine in its own right. More than 250 GW of renewable capacity has been contracted globally through corporate power purchase agreements, and hyperscale data-center operators are among the most aggressive buyers, racing toward 100% renewable electricity for their operations. That appetite is showing up at the project level too — recent months brought a workspace operator building a 10 MWp solar plant in Karnataka for its own transition, along with independent power producers locking in large repeat orders for high-efficiency modules. 24-hour renewable portfolios, which utilize the integration of solar, wind, and storage for providing steady electricity, are receiving renewed investments precisely because of their ability to overcome the issue of reliability that has been standing in the way of adoption in the past. The agrivoltaics, community solar projects, and virtual power plants all seem to be transitioning from pilots to full deployment – a positive indication of adoption curve expanding to decentralized forms.
What Could Slow This Down
Grid infrastructure is probably the biggest bottleneck of all. Transmission expansion is lagging capacity additions in several markets, and closing that gap will take several hundred billion dollars of investment through 2034. Storage deployment at the scale needed for high renewable penetration is itself a trillion-dollar-plus undertaking. Critical mineral supply chains remain geographically concentrated — a vulnerability that recycling and circular-economy investment is only just beginning to address. And permitting delays, along with biodiversity concerns for offshore wind and large hydropower, will keep slowing individual project timelines even in cases where the underlying economics are clearly favorable.
Who’s Actually Competing
The competition will polarize itself in two groups – diversified power companies and technology firms. NextEra Energy and Iberdrola are developing multi-technology product ranges including solar energy, wind, energy storage, and hydropower. Wind energy suppliers and offshore development will be represented by Vestas, Siemens Gamesa, and Ørsted companies. In terms of solar energy, the manufacturing volume in China drives the industry, and Chinese companies such as LONGi Green Energy and JinkoSolar are ahead. Diversified owners like Brookfield Renewable Partners round things out — and increasingly, it’s scale and geographic diversification that separate the leaders from smaller, single-market developers.
The Bottom Line
That 8.6% CAGR through 2034 isn’t really a forecast of continued momentum — it’s a description of a market that has already changed what it is. It’s gone from subsidy-dependent to cost-competitive, from niche to mainstream, from a story about generation alone to one about generation, grid, and storage together. The companies that win from here will be the ones treating transmission and storage as central to their investment thesis — not as an afterthought bolted on after the panels and turbines are already ordered.
Reference: https://marketintelo.com/report/renewable-energy-market