The IEA is delighted to inform of the release of its new Energy and Emissions per Value Added database.
Value added data is the basis for analysing how economies are structured, and to develop sectoral energy intensity indicators – useful to monitor trends in the economic efficiency of various activities, as a complement to data based on physical indicators.
The database includes:
- A compilation of value added data up to ISIC 2-digits level from various third-party sources, at global level.
- Energy intensity indicators (e.g. MJ/USD PPP 2015 by manufacturing sector), coupling value added with energy and emissions data from the IEA.
Combined with energy consumption data, energy intensity indicators can be derived from value added, offering a better geographical coverage (global) compared to commodity data, and homogeneous indicators in terms of unit across all sectors.
Energy intensity trends can be compared across sectors, countries and over time.
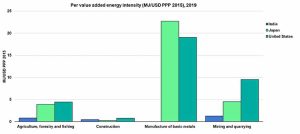
In a subset of three countries – India, Japan and the United States – manufacture of basics metals is on average 40 times more energy intensive per unit of value added compared to construction sector, with large country variability.
While energy intensity of manufacture of basic metals and manufacture of paper products and printing have similar intensities in 2021 in the USA, energy intensity of the former was cut by half over the period 2000-2021, while the latter remained unchanged.
Feel free to reach us at EnergyIndicators@iea.org for any question.