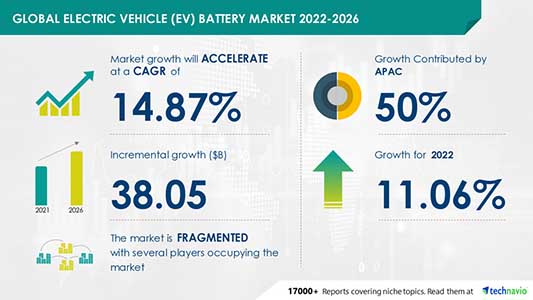
The Electric Vehicle (EV) Battery Market size is expected to grow by USD 38.05 billion at a CAGR of 14.87% during the forecast period. The electric vehicle (EV) battery market report also offers information on several market vendors, including A123 Systems LLC, Ballard Power Systems Inc., BYD Co. Ltd., Clarios, Crown Battery Manufacturing Co., Cummins Inc., East Penn Manufacturing Co. Inc., LG Chem Ltd., Zhejiang Narada Power Source Co. Ltd., OptimumNano Energy Co. Ltd., Panasonic Corp., Samsung SDI Co. Ltd., SK Innovation Co. Ltd., Solid Power Inc., and Tianneng Battery among others.
The electric vehicle (EV) battery market has been broadly categorized into the following demographic segmentations:
- Type – Lithium-ion battery and lead-acid battery
- Geography – APAC, Europe, North America, South America, and the Middle East and Africa.
Read the 120-page report with TOC on “Electric Vehicle (EV) Battery Market Analysis Report by Type and Geography and the Segment Forecasts,2022-2026.” Buy Sample Report!
Major Five Electric Vehicle (EV) Battery Companies
The growing competition in the market is compelling vendors to adopt various growth strategies such as promotional activities and spending on advertisements to improve the visibility of their services. Some vendors are also adopting inorganic growth strategies such as M&As to remain competitive in the market.
- A123 Systems LLC
- Ballard Power Systems Inc.
- BYD Co. Ltd.
- Clarios
- Crown Battery Manufacturing Co.
- Cummins Inc.
- East Penn Manufacturing Co. Inc.
- EnerSys
- Enertech International Inc.
- Envision Energy USA Ltd.
- Exide Industries Ltd.
Find additional highlights on the growth strategies adopted by vendors and their product offerings, Read Latest Sample Report.
Key Market Dynamics
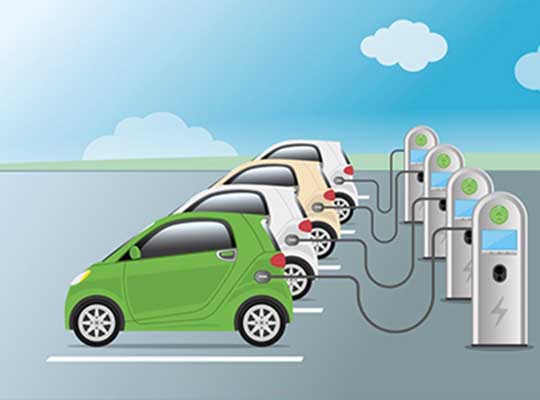
One of the main factors fueling the expansion of the electric vehicle (EV) battery market is the rising demand for EVs and their expanded applications. Due to the following reasons, consumers are now beginning to purchase hybrid electric vehicles (HEVs):
- The tendency has been toward lower fuel and GHG emissions. As a result, people are choosing greener vehicles.
- To encourage the use of greener automobiles, many nations provide a range of alluring incentives and tax advantages.
- To lessen the effects of global warming and curb GHG emissions, the majority of nations have established strict emission standards.
During the projected period, these measures will drive the growth of the electric vehicle (EV) battery market.
Download Sample Report for highlights on market Drivers & Challenges affecting the Electric Vehicle Battery Market.
Related Reports:
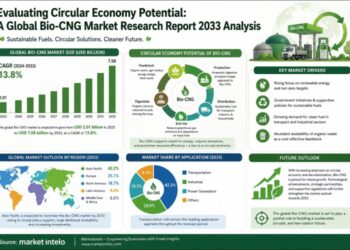
Solar Shingles Market by Type and Geography – Forecast and Analysis 2022-2026: The solar shingles market share is expected to increase to USD 618.91 million from 2021 to 2026, and the market’s growth momentum will decelerate at a CAGR of 5.2%.
Solar Home Systems Market by Type and Geography – Forecast and Analysis 2022-2026: The solar home systems market share is expected to increase to USD 1.39 billion from 2021 to 2026, and the market’s growth momentum will accelerate at a CAGR of 21.4%.
| Electric Vehicle (EV) Battery Market Scope | |
| Report Coverage | Details |
| Page number | 120 |
| Base year | 2021 |
| Forecast period | 2022-2026 |
| Growth momentum & CAGR | Accelerate at a CAGR of 14.87% |
| Market growth 2022-2026 | $ 38.05 billion |
| Market structure | Fragmented |
| YoY growth (%) | 11.06 |
| Regional analysis | APAC, Europe, North America, South America, and Middle East and Africa |
| Performing market contribution | APAC at 50% |
| Key consumer countries | US, China, Japan, Norway, Germany, US, China, Japan, Norway, Germany, US, China, Japan, Norway, and Germany |
| Competitive landscape | Leading companies, competitive strategies, consumer engagement scope |
| Companies profiled | A123 Systems LLC, Ballard Power Systems Inc., BYD Co. Ltd., Clarios, Crown Battery Manufacturing Co., Cummins Inc., East Penn Manufacturing Co. Inc., EnerSys, Enertech International Inc., Envision Energy USA Ltd., Exide Industries Ltd., GS Yuasa Corp., Hitachi Ltd., LG Chem Ltd., Zhejiang Narada Power Source Co. Ltd., OptimumNano Energy Co. Ltd., Panasonic Corp., Samsung SDI Co. Ltd., SK Innovation Co. Ltd., Solid Power Inc., and Tianneng Battery |
| Market Dynamics | Parent market analysis, Market growth inducers and obstacles, Fast-growing and slow-growing segment analysis, COVID 19 impact and future consumer dynamics, market condition analysis for the forecast period, |
| Customization purview | If our report has not included the data that you are looking for, you can reach out to our analysts and get segments customized. |
Table of Contents
1 Executive Summary
- 1.1 Market overview
- Exhibit 01: Executive Summary – Chart on Market Overview
- Exhibit 02: Executive Summary – Data Table on Market Overview
- Exhibit 03: Executive Summary – Chart on Global Market Characteristics
- Exhibit 04: Executive Summary – Chart on Market by Geography
- Exhibit 05: Executive Summary – Chart on Market Segmentation by Type
- Exhibit 06: Executive Summary – Chart on Incremental Growth
- Exhibit 07: Executive Summary – Data Table on Incremental Growth
- Exhibit 08: Executive Summary – Chart on Vendor Market Positioning
2 Market Landscape
- 2.1 Market ecosystem
- Exhibit 09: Parent market
- Exhibit 10: Market Characteristics
3 Market Sizing
- 3.1 Market definition
- Exhibit 11: Offerings of vendors included in the market definition
- 3.2 Market segment analysis
- Exhibit 12: Market segments
- 3.3 Market size 2021
- 3.4 Market outlook: Forecast for 2021-2026
- Exhibit 13: Chart on Global – Market size and forecast 2021-2026 ($ billion)
- Exhibit 14: Data Table on Global – Market size and forecast 2021-2026 ($ billion)
- Exhibit 15: Chart on Global Market: Year-over-year growth 2021-2026 (%)
- Exhibit 16: Data Table on Global Market: Year-over-year growth 2021-2026 (%)
4 Five Forces Analysis
- 4.1 Five forces summary
- Exhibit 17: Five forces analysis – Comparison between2021 and 2026
- 4.2 Bargaining power of buyers
- Exhibit 18: Chart on Bargaining power of buyers – Impact of key factors 2021 and 2026
- 4.3 Bargaining power of suppliers
- Exhibit 19: Bargaining power of suppliers – Impact of key factors in 2021 and 2026
- 4.4 Threat of new entrants
- Exhibit 20: Threat of new entrants – Impact of key factors in 2021 and 2026
- 4.5 Threat of substitutes
- Exhibit 21: Threat of substitutes – Impact of key factors in 2021 and 2026
- 4.6 Threat of rivalry
- Exhibit 22: Threat of rivalry – Impact of key factors in 2021 and 2026
- 4.7 Market condition
- Exhibit 23: Chart on Market condition – Five forces 2021 and 2026
5 Market Segmentation by Type
- 5.1 Market segments
- Exhibit 24: Chart on Type – Market share 2021-2026 (%)
- Exhibit 25: Data Table on Type – Market share 2021-2026 (%)
- 5.2 Comparison by Type
- Exhibit 26: Chart on Comparison by Type
- Exhibit 27: Data Table on Comparison by Type
- 5.3 Lithium-ion battery – Market size and forecast 2021-2026
- Exhibit 28: Chart on Lithium-ion battery – Market size and forecast 2021-2026 ($ billion)
- Exhibit 29: Data Table on Lithium-ion battery – Market size and forecast 2021-2026 ($ billion)
- Exhibit 30: Chart on Lithium-ion battery – Year-over-year growth 2021-2026 (%)
- Exhibit 31: Data Table on Lithium-ion battery – Year-over-year growth 2021-2026 (%)
- 5.4 Lead-acid battery – Market size and forecast 2021-2026
- Exhibit 32: Chart on Lead-acid battery – Market size and forecast 2021-2026 ($ billion)
- Exhibit 33: Data Table on Lead-acid battery – Market size and forecast 2021-2026 ($ billion)
- Exhibit 34: Chart on Lead-acid battery – Year-over-year growth 2021-2026 (%)
- Exhibit 35: Data Table on Lead-acid battery – Year-over-year growth 2021-2026 (%)
- 5.5 Others – Market size and forecast 2021-2026
- Exhibit 36: Chart on Others – Market size and forecast 2021-2026 ($ billion)
- Exhibit 37: Data Table on Others – Market size and forecast 2021-2026 ($ billion)
- Exhibit 38: Chart on Others – Year-over-year growth 2021-2026 (%)
- Exhibit 39: Data Table on Others – Year-over-year growth 2021-2026 (%)
- 5.6 Market opportunity by Type
- Exhibit 40: Market opportunity by Type ($ billion)
6 Customer Landscape
- 6.1 Customer landscape overview
- Exhibit 41: Analysis of price sensitivity, lifecycle, customer purchase basket, adoption rates, and purchase criteria
7 Geographic Landscape
- 7.1 Geographic segmentation
- Exhibit 42: Chart on Market share by geography 2021-2026 (%)
- Exhibit 43: Data Table on Market share by geography 2021-2026 (%)
- 7.2 Geographic comparison
- Exhibit 44: Chart on Geographic comparison
- Exhibit 45: Data Table on Geographic comparison
- 7.3 APAC – Market size and forecast 2021-2026
- Exhibit 46: Chart on APAC – Market size and forecast 2021-2026 ($ billion)
- Exhibit 47: Data Table on APAC – Market size and forecast 2021-2026 ($ billion)
- Exhibit 48: Chart on APAC – Year-over-year growth 2021-2026 (%)
- Exhibit 49: Data Table on APAC – Year-over-year growth 2021-2026 (%)
- 7.4 Europe – Market size and forecast 2021-2026
- Exhibit 50: Chart on Europe – Market size and forecast 2021-2026 ($ billion)
- Exhibit 51: Data Table on Europe – Market size and forecast 2021-2026 ($ billion)
- Exhibit 52: Chart on Europe – Year-over-year growth 2021-2026 (%)
- Exhibit 53: Data Table on Europe – Year-over-year growth 2021-2026 (%)
- 7.5 North America – Market size and forecast 2021-2026
- Exhibit 54: Chart on North America – Market size and forecast 2021-2026 ($ billion)
- Exhibit 55: Data Table on North America – Market size and forecast 2021-2026 ($ billion)
- Exhibit 56: Chart on North America – Year-over-year growth 2021-2026 (%)
- Exhibit 57: Data Table on North America – Year-over-year growth 2021-2026 (%)
- 7.6 South America – Market size and forecast 2021-2026
- Exhibit 58: Chart on South America – Market size and forecast 2021-2026 ($ billion)
- Exhibit 59: Data Table on South America – Market size and forecast 2021-2026 ($ billion)
- Exhibit 60: Chart on South America – Year-over-year growth 2021-2026 (%)
- Exhibit 61: Data Table on South America – Year-over-year growth 2021-2026 (%)
- 7.7 Middle East and Africa – Market size and forecast 2021-2026
- Exhibit 62: Chart on Middle East and Africa – Market size and forecast 2021-2026 ($ billion)
- Exhibit 63: Data Table on Middle East and Africa – Market size and forecast 2021-2026 ($ billion)
- Exhibit 64: Chart on Middle East and Africa – Year-over-year growth 2021-2026 (%)
- Exhibit 65: Data Table on Middle East and Africa – Year-over-year growth 2021-2026 (%)
- 7.8 China – Market size and forecast 2021-2026
- Exhibit 66: Chart on China – Market size and forecast 2021-2026 ($ billion)
- Exhibit 67: Data Table on China – Market size and forecast 2021-2026 ($ billion)
- Exhibit 68: Chart on China – Year-over-year growth 2021-2026 (%)
- Exhibit 69: Data Table on China – Year-over-year growth 2021-2026 (%)
- 7.9 US – Market size and forecast 2021-2026
- Exhibit 70: Chart on US – Market size and forecast 2021-2026 ($ billion)
- Exhibit 71: Data Table on US – Market size and forecast 2021-2026 ($ billion)
- Exhibit 72: Chart on US – Year-over-year growth 2021-2026 (%)
- Exhibit 73: Data Table on US – Year-over-year growth 2021-2026 (%)
- 7.10 Norway – Market size and forecast 2021-2026
- Exhibit 74: Chart on Norway – Market size and forecast 2021-2026 ($ billion)
- Exhibit 75: Data Table on Norway – Market size and forecast 2021-2026 ($ billion)
- Exhibit 76: Chart on Norway – Year-over-year growth 2021-2026 (%)
- Exhibit 77: Data Table on Norway – Year-over-year growth 2021-2026 (%)
- 7.11 Germany – Market size and forecast 2021-2026
- Exhibit 78: Chart on Germany – Market size and forecast 2021-2026 ($ billion)
- Exhibit 79: Data Table on Germany – Market size and forecast 2021-2026 ($ billion)
- Exhibit 80: Chart on Germany – Year-over-year growth 2021-2026 (%)
- Exhibit 81: Data Table on Germany – Year-over-year growth 2021-2026 (%)
- 7.12 Japan – Market size and forecast 2021-2026
- Exhibit 82: Chart on Japan – Market size and forecast 2021-2026 ($ billion)
- Exhibit 83: Data Table on Japan – Market size and forecast 2021-2026 ($ billion)
- Exhibit 84: Chart on Japan – Year-over-year growth 2021-2026 (%)
- Exhibit 85: Data Table on Japan – Year-over-year growth 2021-2026 (%)
- 7.13 Market opportunity by geography
- Exhibit 86: Market opportunity by geography ($ billion)
8 Drivers, Challenges, and Trends
- 8.1 Market drivers
- 8.2 Market challenges
- 8.3 Impact of drivers and challenges
- Exhibit 87: Impact of drivers and challenges in 2021 and 2026
- 8.4 Market trends
9 Vendor Landscape
- 9.1 Overview
- 9.2 Vendor landscape
- Exhibit 88: Overview on Criticality of inputs and Factors of differentiation
- 9.3 Landscape disruption
- Exhibit 89: Overview on factors of disruption
- 9.4 Industry risks
- Exhibit 90: Impact of key risks on business
10 Vendor Analysis
- 10.1 Vendors covered
- Exhibit 91: Vendors covered
- 10.2 Market positioning of vendors
- Exhibit 92: Matrix on vendor position and classification
- 10.3 A123 Systems LLC
- Exhibit 93: A123 Systems LLC – Overview
- Exhibit 94: A123 Systems LLC – Product / Service
- Exhibit 95: A123 Systems LLC – Key offerings
- 10.4 Ballard Power Systems Inc.
- Exhibit 96: Ballard Power Systems Inc. – Overview
- Exhibit 97: Ballard Power Systems Inc. – Business segments
- Exhibit 98: Ballard Power Systems Inc. – Key news
- Exhibit 99: Ballard Power Systems Inc. – Key offerings
- Exhibit 100: Ballard Power Systems Inc. – Segment focus
- 10.5 BYD Co. Ltd.
- Exhibit 101: BYD Co. Ltd. – Overview
- Exhibit 102: BYD Co. Ltd. – Business segments
- Exhibit 103: BYD Co. Ltd. – Key news
- Exhibit 104: BYD Co. Ltd. – Key offerings
- Exhibit 105: BYD Co. Ltd. – Segment focus
- 10.6 Cummins Inc.
- Exhibit 106: Cummins Inc. – Overview
- Exhibit 107: Cummins Inc. – Business segments
- Exhibit 108: Cummins Inc. – Key offerings
- Exhibit 109: Cummins Inc. – Segment focus
- 10.7 EnerSys
- Exhibit 110: EnerSys – Overview
- Exhibit 111: EnerSys – Business segments
- Exhibit 112: EnerSys – Key news
- Exhibit 113: EnerSys – Key offerings
- Exhibit 114: EnerSys – Segment focus
- 10.8 Exide Industries Ltd.
- Exhibit 115: Exide Industries Ltd. – Overview
- Exhibit 116: Exide Industries Ltd. – Business segments
- Exhibit 117: Exide Industries Ltd. – Key offerings
- Exhibit 118: Exide Industries Ltd. – Segment focus
- 10.9 GS Yuasa Corp.
- Exhibit 119: GS Yuasa Corp. – Overview
- Exhibit 120: GS Yuasa Corp. – Business segments
- Exhibit 121: GS Yuasa Corp. – Key news
- Exhibit 122: GS Yuasa Corp. – Key offerings
- Exhibit 123: GS Yuasa Corp. – Segment focus
- 10.10 LG Chem Ltd.
- Exhibit 124: LG Chem Ltd. – Overview
- Exhibit 125: LG Chem Ltd. – Business segments
- Exhibit 126: LG Chem Ltd. – Key news
- Exhibit 127: LG Chem Ltd. – Key offerings
- Exhibit 128: LG Chem Ltd. – Segment focus
- 10.11 Panasonic Corp.
- Exhibit 129: Panasonic Corp. – Overview
- Exhibit 130: Panasonic Corp. – Business segments
- Exhibit 131: Panasonic Corp. – Key offerings
- Exhibit 132: Panasonic Corp. – Segment focus
- 10.12 Samsung SDI Co. Ltd.
- Exhibit 133: Samsung SDI Co. Ltd. – Overview
- Exhibit 134: Samsung SDI Co. Ltd. – Business segments
- Exhibit 135: Samsung SDI Co. Ltd. – Key offerings
- Exhibit 136: Samsung SDI Co. Ltd. – Segment focus
11 Appendix
- 11.1 Scope of the report
- 11.2 Inclusions and exclusions checklist
- Exhibit 137: Inclusions checklist
- Exhibit 138: Exclusions checklist
- 11.3 Currency conversion rates for US$
- Exhibit 139: Currency conversion rates for US$
- 11.4 Research methodology
- Exhibit 140: Research methodology
- Exhibit 141: Validation techniques employed for market sizing
- Exhibit 142: Information sources
- 11.5 List of abbreviations
- Exhibit 143: List of abbreviations